点击按钮跳转至开发者官方下载地址...
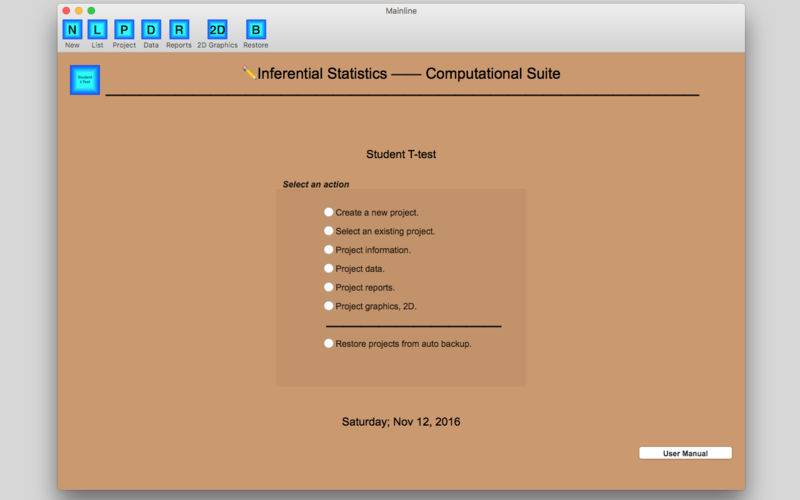
Student T-test will analyze a sample dataset, comparing the sample’s mean to the population mean, or desired population mean. A summary table is produced along with graphics showing the statistical significance at the 90%, 95%, 97.5%, 98%, 99% and 99.5% levels depending on if the test is 1-tailed or 2-tailed.
Note that this is a single sample t-test app. For a two sample (paired or non-paired) refer to the “Paired T-test” app.


