点击按钮跳转至开发者官方下载地址...
MetaFlow is powerful information visualization software, now available FREE for non-commercial use only. Visit us at http://graphicalmemes.com for more information, to request features, or to inquire about custom software development.
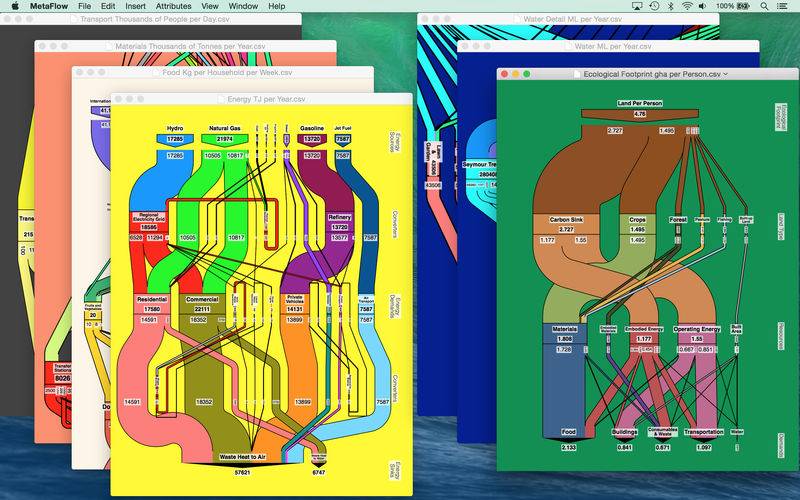
MetaFlow is a tool for creating flow network diagrams, also known as Sankey diagrams. Metaphorically, the diagrams depict a set of tubes through which fluid flows. Each tube runs between two stages in the flow, and connects with other tubes at one of the junctions located within each stage. The width of a tube is an indication of the amount of fluid passing through it per unit time, so junctions are balanced (flow is conserved) as long as the sum of the widths of incoming tubes equals the sum of the widths of outgoing tubes.
While these diagrams can be used to describe the flow of actual fluids, they can also be used to describe the progression of a broad variety of quantities through a broad variety of processes. For example, the quantity might be energy, money, people, traffic, information or carbon footprint. Even in the case of a fluid such as water, gas or oil, the tubes normally represent aggregate flows rather than actual pipes. For example, one tube might represent the total amount of water taken from rivers and used directly for agricultural purposes, in which case the tube would connect a “river water” junction to an “agricultural use” junction. There may be another tube connecting “river water” to “human consumption,” although it is likely that this flow would have to go via a “water treatment plant” junction at an intermediate stage.
MetaFlow is an excellent tool for representing the various systems that comprise urban metabolism, including energy, food, water, waste, transportation and communications. MetaFlow diagrams provide a whole-system view that elucidates the dependencies and relative importance of component processes. MetaFlow is also applicable in many other contexts, such as factory planning, Web analytics or finance.
Here are some of MetaFlow's salient features:
AUTOMATIC LAYOUT
There is no need for you to specify the position, size or shape of diagram elements. MetaFlow uses sophisticated mathematical algorithms to optimize the layout for you. You just specify what is connected to what, and MetaFlow takes care of the rest.
WYSIWYG EDITOR
Edit labels and quantities in place, and diagram elements will be re-positioned and re-routed as necessary. Adjust colors and border width to communicate additional information and express your style.
HYPERLINKS
Add a hyperlink to any stage, junction or tube. Double-clicking will visit your target location in a browser or other appropriate external application (such as Maps or Mail).
HIGH-PERFORMANCE, FULL-RESOLUTION ZOOM
Zoom and pan very detailed diagrams, and lines will always be crisp, with no pixellation. This includes support for pinch zoom and smart zoom on Macs with a multitouch trackpad.
SPREADSHEET, DATABASE AND XML CONNECTIVITY
MetaFlow can read and save CSV or XML, thereby providing advanced users with the option of creating diagrams from spreadsheet formulas or data conversions.
COMPATIBILITY
Diagrams can be exported as PDF, a widely-supported document format that allows others to view your diagrams, and allows you to incorporate your diagrams as images inside documents you create with other programs. Hyperlinks are preserved in the exported PDF files.
DIAGRAMS IN THE CLOUD
Start working on a diagram on one computer, and continue on another without needing to explicitly save or transfer the file. With iCloud Drive support, you can even access your files from Windows, further enlarging spreadsheet or database connectivity options.
AUTOSAVE AND VERSIONS
Experiment to your heart's content, since you can always get back to where you started. Browse snapshots of previous versions to select the one you want, or take advantage of unlimited levels of undo/redo.


